PLGA Market

PLGA Market by Composition, Application (Medical, Non-Medical Applications), Processibility (Extrusion, Injection Molding), End-Use Industry (Healthcare, Biotech Firms, Medical Institutions, Packaging, Textile, Agriculture) - Global Forecast to 2030

Report Code: CH 8978 Mar, 2024, by marketsandmarkets.com

Updated on : April 15, 2024

PLGA Market

PLGA Market was valued at USD 121 million in 2023 and is projected to grow from USD 200 million in 2027 to USD 321 million by 2030, growing at 16.6% cagr during the forecast period. As a biodegradable and biocompatible polymer, PLGA has garnered significant attention across various sectors, particularly in pharmaceuticals, healthcare, and beyond. Its versatility and tunable properties make it an ideal candidate for drug delivery systems, implants, tissue engineering, and a host of other applications. With the global healthcare sector witnessing a paradigm shift towards personalized medicine and advanced therapies, the demand for PLGA-based products continues to soar, driven by the need for targeted drug delivery, improved patient outcomes, and reduced side effects. Moreover, the growing emphasis on sustainability and environmental stewardship further bolsters the market for PLGA, as businesses seek eco-friendly alternatives to traditional plastics in packaging, agriculture, and other industries. Companies operating in the PLGA market are investing in research and development to enhance product performance, expand application areas, and capitalize on emerging market trends.

Attractive Opportunities in the PLGA Market
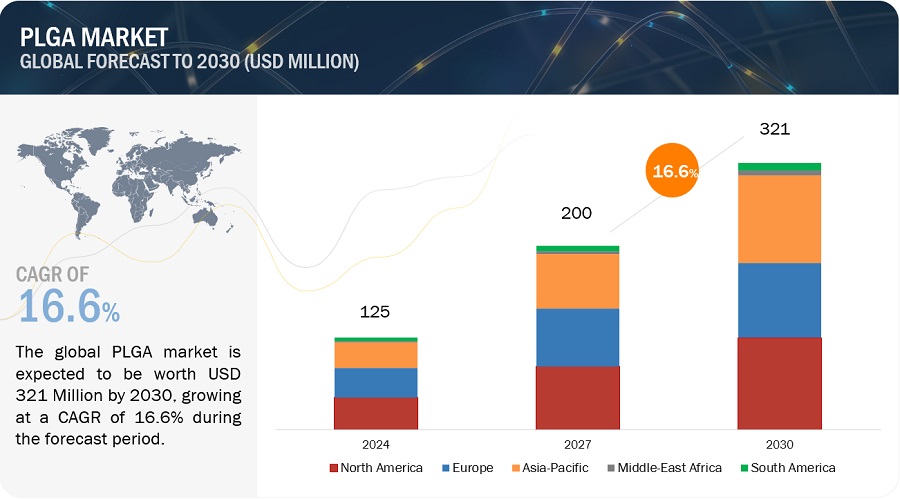
PLGA Market

To know about the assumptions considered for the study, Request for Free Sample Report
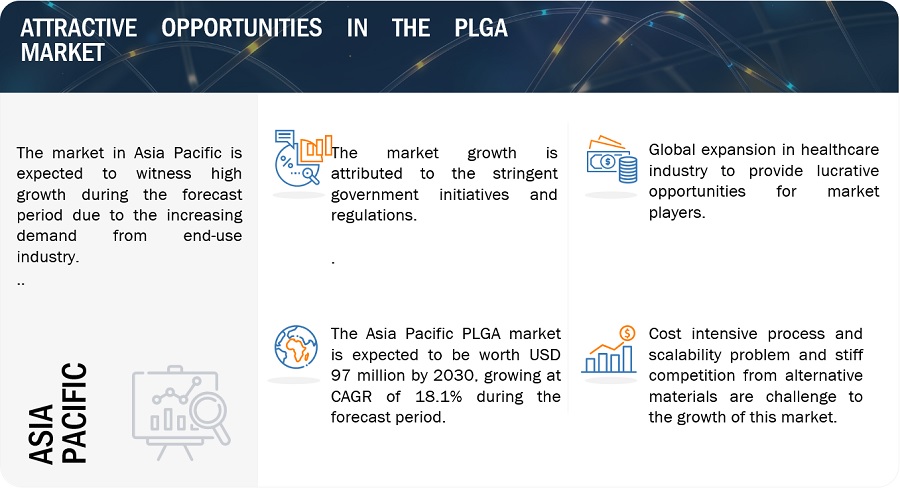
PLGA Market

PLGA Market Dynamics

Driver: Government initiatives and regulations

Government initiatives and regulations wield substantial influence over the trajectory of the PLGA market. Regulatory support for biodegradable polymers, notably PLGA, varies globally, impacting market dynamics in significant ways. For instance, countries like Germany and France have implemented stringent regulations favoring eco-friendly materials in packaging. This has propelled the adoption of PLGA in the packaging industry, aligning with environmental directives and creating a demand for sustainable alternatives.  In the healthcare sector, the US Food and Drug Administration (FDA) emphasizes the importance of biocompatibility and biodegradability in medical devices. This aligns with the qualities inherent in PLGA, positioning it favorably for use in medical implants and drug delivery systems. The European Medicines Agency (EMA) also follows a similar path, promoting the use of biodegradable materials in pharmaceutical applications, bolstering the market for PLGA-based drug delivery solutions. Furthermore, countries like Japan, with a strong focus on technological innovation, have implemented supportive policies for research and development in biodegradable polymers. Such initiatives encourage companies to invest in advancing technologies related to PLGA, fostering innovation and market growth.

Restraint: Complex manufacturing process

The complexity of manufacturing processes stands as a significant restraining factor for the PLGA market.  PLGA is derived from the condensation polymerization of lactic acid and glycolic acid, requiring precise control over reaction conditions, temperatures, and catalysts to achieve the desired molecular weight and composition. This step alone demands a high degree of precision to ensure the quality and characteristics of the final PLGA product. Subsequent to the polymerization, the purification process involves multiple stages to eliminate impurities and unreacted monomers. Achieving the required level of purity is critical for the biocompatibility and performance of PLGA in various applications. The purification process adds an additional layer of complexity to the manufacturing sequence. Furthermore, the formulation of PLGA-based products often involves incorporating therapeutic agents or tailoring the polymer for specific applications. Achieving uniform dispersion of drugs or additives within the PLGA matrix requires meticulous attention to formulation parameters and the use of specialized equipment. This step contributes to the overall complexity, especially in the context of developing controlled drug delivery systems with precise release profiles. The intricate nature of PLGA manufacturing is also evident in the processing steps, where the polymer is shaped into various forms such as microspheres, nanoparticles, or implantable devices. These shaping processes require advanced technologies and a deep understanding of the material's behavior under different conditions.

Opportunity: Global expansion in healthcare industry

The global expansion of healthcare infrastructure presents a strategic opportunity for PLGA-based products. In response to evolving healthcare systems worldwide that prioritize advanced therapeutic solutions, PLGA emerges as a pivotal player to meet the escalating demand for efficient and patient-friendly medical interventions. In the US, PLGA-based drug delivery systems are gaining prominence, aligning with the country's focus on personalized medicine. China's robust healthcare growth, fueled by government initiatives, positions PLGA favorably in drug delivery and regenerative medicine applications. In India, PLGA's role in controlled drug delivery resonates with the nation's emphasis on affordable and accessible healthcare solutions. The European Union's commitment to sustainable healthcare practices opens avenues for PLGA's biodegradable properties in medical products. Brazil's expanding healthcare market offers opportunities for PLGA in medical implants and drug delivery systems. Across the Middle East and North Africa, investments in healthcare infrastructure create opportunities for PLGA applications in emerging markets. In Japan, PLGA finds a niche in regenerative medicine and medical devices amid an aging population and a conducive regulatory environment. This global panorama underscores PLGA's versatile applications and positions it strategically in the dynamic landscape of evolving healthcare needs.

Challenge: Cost intensive process and scalability  problem.

Cost factors pose a substantial challenge in the PLGA market, particularly during the production phase, where the synthesis of high-quality PLGA relies on raw materials such as lactic acid and glycolic acid. The cost-intensive nature of procuring these raw materials, coupled with their potential price fluctuations, introduces intricacies into the overall cost structure of PLGA production. Manufacturers are confronted with the dual challenge of ensuring affordability for PLGA-based products and navigating the susceptibility to raw material cost fluctuations, which can directly impact profit margins.

Furthermore, the scalability of PLGA production compounds the challenges facing manufacturers. With an escalating demand for PLGA-based products, companies are tasked with the intricate process of scaling up production while upholding consistent quality standards. This undertaking requires deliberate and strategic investments in production infrastructure, as well as dedicated research and development efforts. Achieving economies of scale without compromising the intrinsic properties of PLGA demands a nuanced approach, encompassing advancements in technology, process optimization, and the development of innovative formulations. Such strategic initiatives are vital in navigating the complexities of scaling up PLGA production, ensuring that increased market demand is met with sustainable, high-quality production processes

PLGA Market Ecosystem
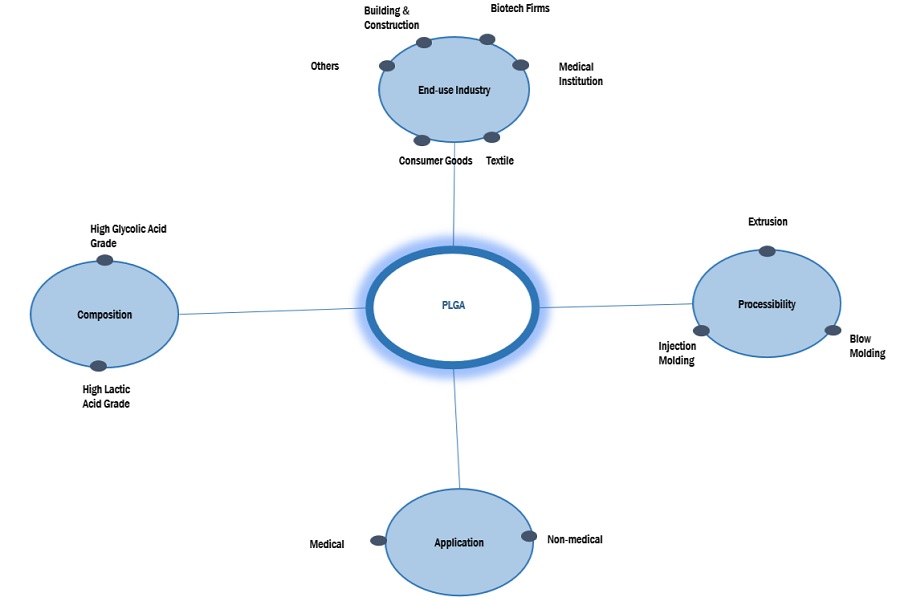
PLGA Market Ecosystem

Source: Secondary Research, Interviews with Experts, and MarketsandMarkets Analysis

"Medical institutions type Segment type was the second largest segment for PLGA market in 2023, in terms of value."

Medical institutions represent a vital end-use industry for PLGA (poly(lactic-co-glycolic acid), leveraging its unique properties to drive advancements in healthcare delivery, patient treatment, and medical device innovation. PLGA, renowned for its biodegradability, biocompatibility, and tunable characteristics, serves as a cornerstone material in a multitude of medical applications. From drug delivery systems to tissue engineering scaffolds and implants, PLGA plays a pivotal role in addressing diverse medical challenges. In drug delivery, PLGA facilitates controlled and sustained release of therapeutics, enhancing treatment efficacy, minimizing side effects, and improving patient compliance. Medical devices incorporating PLGA, such as surgical sutures, implants, and stents, benefit from its biocompatibility and mechanical strength, offering safe and reliable solutions for patient care. Additionally, PLGA-based tissue engineering scaffolds provide a platform for regenerative medicine, enabling the repair and regeneration of damaged tissues and organs. With medical institutions at the forefront of healthcare innovation, the demand for PLGA continues to escalate, driving research and development efforts to further optimize its properties and expand its applications.

"Asia Pacific was the fastest growing market for PLGA in 2023, in terms of value."

The Asia-Pacific region is rapidly emerging as a lucrative market for PLGA (poly (lactic-co-glycolic acid)), fueled by a convergence of factors that present compelling opportunities for businesses operating in the polymer industry. One of the primary drivers of this growth is the burgeoning healthcare sector in countries across Asia-Pacific, characterized by increasing investments in pharmaceuticals, biotechnology, and medical devices. As the demand for advanced drug delivery systems, implants, and tissue engineering scaffolds continues to rise, there is a corresponding surge in the adoption of PLGA, which offers exceptional biodegradability, biocompatibility, and tunable properties perfectly suited to meet the evolving needs of the healthcare industry. Moreover, the region's robust manufacturing infrastructure, coupled with a skilled workforce and favorable regulatory environment, positions Asia-Pacific as an attractive destination for PLGA production and processing.
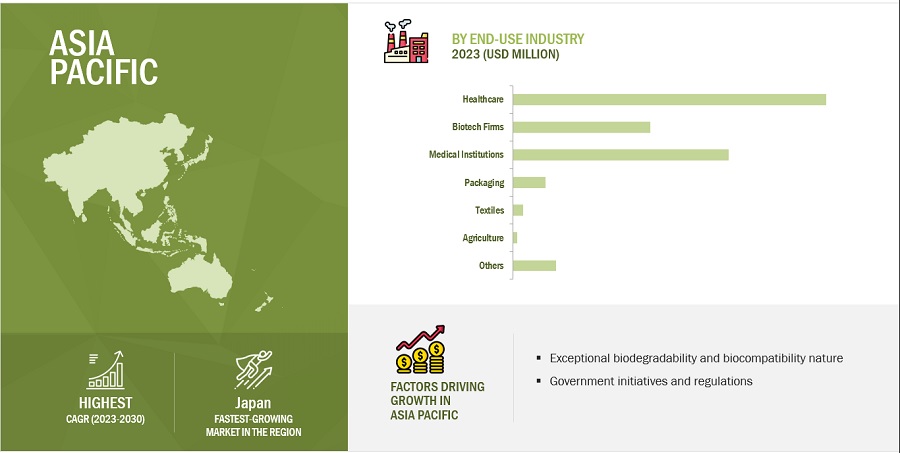
PLGA Market by Region

To know about the assumptions considered for the study, download the pdf brochure

PLGA Market Players

The key players in this market Evonik (Germany), Corbion NV (Netherlands), Ashland (US), Mitsui Chemicals (Japan), Jinan Digang Bioengineering Co., Ltd. (China), Merck (Germany), Akina, Inc. (US), Nomisma Healthcare Pvt. Ltd. (India), Bezwada Biomedical, LLC (US), CD Bioparticles (US).

PLGA Market Report Scope

Report Metric

Details

Years considered for the study

2020-2022

Base Year

2023

Forecast period

2024–2030

Units considered

Ton; Value (USD Million/Billion)

Segments

Composition, Processibility, End-use Industry Application, and Region

Regions

Asia Pacific, North America, Europe, Middle East & Africa, and South America

Companies

Evonik (Germany), Corbion NV (Netherlands), Ashland (US), Mitsui Chemicals (Japan), Jinan Digang Bioengineering Co., Ltd. (China), Merck (Germany), Akina, Inc. (US), Nomisma Healthcare Pvt. Ltd. (India), Bezwada Biomedical, LLC (US), CD Bioparticles (US).

This report categorizes the global PLGA market based on composition, processibility, end-use industry, application, and region.

PLGA Market based on the Composition:
  • PLGA 50:50
  • PLGA 55:45
  • PLGA 65:35
  • PLGA 75:25
  • PLGA 85:15
  • PLGA 12:88
  • PLGA 10:90
  • Others
PLGA Market based on the Processibility:
  • Extrusion
  • Injection Moulding
  • Others
PLGA Market based on the Type:
  • Dayglow Pigments
  • Phosphorescent Pigments
  • Other Types
PLGA Market based on the Application:
  • Drug Delivery
  • Medical Implants
  • Tissue Engineering
  • Diagnostics Imaging Agents
  • Fracture Fixation
  • Gene Delivery
  • Surgical Sutures
  • Cosmetics & Dermatology
  • Packaging
  • Disposable Cutlery
  • Textile
  • Agricultural Films
  • Others
PLGA Market based on the End-use industry:
  • Healthcare
  • Biotech firms
  • Medical Institutions
  • Packaging
  • Textile
  • Agriculture
  • Other End-Use Industries
PLGA Market based on the Region:
  • Asia Pacific
  • Europe
  • North America
  • South America
  • Middle East & Africa

Recent Developments

  • In March 2023, Evonik joined BellaSeno to commercialize innovative 3D-printed scaffolds for bone regeneration.
  • In August 2022, Ashland has unveiled a strategic expansion of its Viatel bioresorbable polymer manufacturing and research and development facility located at the National Science Park in Mullingar, Ireland. The National Science Park is a hub for innovative organizations.
  • In April 2021, Corbion is expanding its production capacity by 40% of lactic acid and its derivatives at its Blair, Neb., plant. This move will help the company to meet the global demand.
  • In December 2020, Evonik has acquired the LACTEL business of biodegradable polymers from Durect Corporation for USD 15 Million.  This move marks a consequential step in the growth agenda of Evonik’s life-science division Nutrition & Care.
  • In June 2020, Evonik launched the RESOMER Precise platform, offering custom functional polymeric excipients. This platform empowers pharmaceutical companies to achieve an unprecedented level of accuracy and precision in controlling the release profile of their parenteral drug products, a capability that was previously unattainable. It is also helping to optimize drug product stability and thereby further reduce regulatory risk for a range of complex parenteral drug products.

Frequently Asked Questions (FAQ):

To speak to our analyst for a discussion on the above findings, click Speak to Analyst

TABLE OF CONTENTS
 
1 INTRODUCTION (Page No. - 19)
    1.1 STUDY OBJECTIVES 
    1.2 MARKET DEFINITION 
           1.2.1 INCLUSIONS & EXCLUSIONS
    1.3 STUDY SCOPE 
           1.3.1 MARKETS COVERED
           1.3.2 REGIONS COVERED
           1.3.3 YEARS CONSIDERED
    1.4 CURRENCY CONSIDERED 
    1.5 UNITS CONSIDERED 
    1.6 STAKEHOLDERS 
 
2 RESEARCH METHODOLOGY (Page No. - 23)
    2.1 RESEARCH DATA 
          FIGURE 1 PLGA MARKET: RESEARCH DESIGN
           2.1.1 SECONDARY DATA
                    2.1.1.1 Key data from secondary sources
           2.1.2 PRIMARY DATA
                    2.1.2.1 Key data from primary sources
                    2.1.2.2 Primary interviews – demand and supply side
                    2.1.2.3 Key industry insights
                    2.1.2.4 Breakdown of primary interviews
    2.2 MARKET SIZE ESTIMATION 
           2.2.1 BOTTOM-UP APPROACH
                    FIGURE 2 PLGA MARKET: BOTTOM-UP APPROACH
           2.2.2 TOP-DOWN APPROACH
                    FIGURE 3 PLGA MARKET: TOP-DOWN APPROACH
    2.3 FORECAST NUMBER CALCULATION 
          FIGURE 4 DEMAND-SIDE FORECAST PROJECTIONS
    2.4 DATA TRIANGULATION 
          FIGURE 5 PLGA MARKET: DATA TRIANGULATION
    2.5 FACTOR ANALYSIS 
    2.6 ASSUMPTIONS 
    2.7 LIMITATIONS & RISKS ASSOCIATED WITH PLGA MARKET 
    2.8 RECESSION IMPACT 
 
3 EXECUTIVE SUMMARY (Page No. - 32)
    FIGURE 6 EXTRUSION PROCESS TO BE LARGEST SEGMENT DURING FORECAST PERIOD
    FIGURE 7 HIGH LACTIC ACID GRADE TO BE LEADING COMPOSITION TYPE SEGMENT DURING FORECAST PERIOD
    FIGURE 8 PACKAGING TO BE FASTEST-GROWING END-USE INDUSTRY DURING FORECAST PERIOD
    FIGURE 9 NON-MEDICAL TO BE FASTER-GROWING APPLICATION SEGMENT DURING FORECAST PERIOD
    FIGURE 10 ASIA PACIFIC TO BE FASTEST-GROWING MARKET DURING FORECAST PERIOD
 
4 PREMIUM INSIGHTS (Page No. - 36)
    4.1 ATTRACTIVE OPPORTUNITIES FOR PLAYERS IN PLGA MARKET 
          FIGURE 11 EMERGING ECONOMIES TO WITNESS HIGH GROWTH IN PLGA MARKET
    4.2 PLGA MARKET, BY END-USE INDUSTRY 
          FIGURE 12 PACKAGING INDUSTRY TO LEAD OVERALL MARKET, DURING FORECAST PERIOD
 
5 MARKET OVERVIEW (Page No. - 37)
    5.1 INTRODUCTION 
    5.2 MARKET DYNAMICS 
          FIGURE 13 DRIVERS, RESTRAINTS, OPPORTUNITIES, AND CHALLENGES IN PLGA MARKET
           5.2.1 DRIVERS
                    5.2.1.1 Exceptional biodegradability and biocompatibility
                    5.2.1.2 Enhanced barrier properties of PLGA elevating food preservation
                    5.2.1.3 Government initiatives and regulations
                                TABLE 1 PLGA MARKET: GOVERNMENT INITIATIVES AND REGULATIONS
           5.2.2 RESTRAINTS
                    5.2.2.1 Complex manufacturing process
                    5.2.2.2 Limited mechanical strength
           5.2.3 OPPORTUNITIES
                    5.2.3.1 Promising frontier in mulch film application
                    5.2.3.2 Leveraging PLGA poly-coated films for sustainable food service packaging
                    5.2.3.3 Global expansion in healthcare industry
           5.2.4 CHALLENGES
                    5.2.4.1 Cost-intensive process and scalability problem
                    5.2.4.2 Stiff competition from alternative materials
    5.3 VALUE CHAIN ANALYSIS 
          FIGURE 14 VALUE CHAIN ANALYSIS
           5.3.1 RAW MATERIAL SUPPLIERS
           5.3.2 MANUFACTURERS
           5.3.3 DISTRIBUTORS
           5.3.4 END USERS
    5.4 PORTER’S FIVE FORCES ANALYSIS 
          FIGURE 15 PLGA MARKET: PORTER’S FIVE FORCES ANALYSIS
           5.4.1 THREAT OF NEW ENTRANTS
           5.4.2 THREAT OF SUBSTITUTES
           5.4.3 BARGAINING POWER OF SUPPLIERS
           5.4.4 BARGAINING POWER OF BUYERS
           5.4.5 INTENSITY OF COMPETITIVE RIVALRY
                    TABLE 2 PLGA MARKET: PORTER’S FIVE FORCES ANALYSIS
    5.5 PATENT ANALYSIS 
           5.5.1 METHODOLOGY
           5.5.2 DOCUMENT TYPES
                    FIGURE 16 GRANTED PATENTS
           5.5.3 PUBLICATION TRENDS IN LAST 10 YEARS
           5.5.4 INSIGHTS
           5.5.5 JURISDICTION ANALYSIS
           5.5.6 TOP APPLICANTS
                    TABLE 3 TOP PATENT APPLICANTS IN LAST 10 YEARS
    5.6 ECOSYSTEM/MARKET MAP 
          FIGURE 17 PLGA MARKET ECOSYSTEM
          TABLE 4 PLGA: ECOSYSTEM
    5.7 TRADE ANALYSIS 
           5.7.1 IMPORT SCENARIO OF POLYLACTIC ACID
                    FIGURE 18 IMPORT OF PLA, BY KEY COUNTRY, 2018–2022
           5.7.2 EXPORT SCENARIO OF POLYLACTIC ACID
                    FIGURE 19 EXPORT OF PLA, BY KEY COUNTRY, 2018–2022
    5.8 MACROECONOMIC OVERVIEW AND KEY TRENDS 
           5.8.1 PLASTIC PRODUCTION
                    TABLE 5 PLASTIC PRODUCTION (MILLION TONS)
           5.8.2 EU PACKAGING WASTE GENERATED, RECOVERED, AND RECYCLED
                    FIGURE 20 EU PACKAGING WASTE GENERATED, RECOVERED, AND RECYCLED, 2010–2021 (KG/CAPITA)
    5.9 TECHNOLOGY ANALYSIS 
           5.9.1 VOLTA TECHNOLOGY
           5.9.2 NANOPARTICLE FORMULATION
           5.9.3 SMART PLGA SYSTEMS
           5.9.4 HYBRID MATERIALS
    5.10 TARIFF & REGULATORY LANDSCAPE 
           5.10.1 KEY COUNTRY-LEVEL ANALYSIS OF REGULATORY DEVELOPMENTS FAVORING ADOPTION OF PLGA
                    5.10.1.1 Direct Developments
                               5.10.1.1.1 Regulatory bodies, government agencies, and other organizations
                                               TABLE 6 REGULATORY BODIES, GOVERNMENT AGENCIES, AND OTHER ORGANIZATIONS
    5.11 INDIRECT DEVELOPMENTS 
           5.11.1 NORTH AMERICA
                    5.11.1.1 US
                    5.11.1.2 Canada
                    5.11.1.3 Mexico
           5.11.2 EUROPE
                    5.11.2.1 Germany
                    5.11.2.2 France
                    5.11.2.3 Spain
                    5.11.2.4 UK
                    5.11.2.5 Sweden
           5.11.3 ASIA PACIFIC
                    5.11.3.1 China
                    5.11.3.2 Japan
                    5.11.3.3 India
                    5.11.3.4 Australia & New Zealand
                    5.11.3.5 Other Asian Countries
           5.11.4 MIDDLE EAST & AFRICA AND SOUTH AMERICA
                    5.11.4.1 Middle East & Africa
                    5.11.4.2 South America
    5.12 EARLY ADOPTING COUNTRIES 
           FIGURE 21 SINGLE-USE PLASTIC BAN, BY COUNTRY
           FIGURE 22 ROAD TO NET ZERO: CARBON NEUTRALITY BY TARGET YEAR
           FIGURE 23 EARLY ADOPTING COUNTRIES FOR PLGA
           5.12.1 US
           5.12.2 CANADA
           5.12.3 GERMANY
           5.12.4 CHINA
           5.12.5 UK
           5.12.6 JAPAN
           5.12.7 DENMARK
           5.12.8 NETHERLANDS
           5.12.9 SWEDEN
                    5.12.10 NORWAY
    5.13 MEDIUM ADOPTING COUNTRIES 
           FIGURE 24 MEDIUM ADOPTING COUNTRIES FOR PLGA
           5.13.1 INDIA
           5.13.2 FRANCE
           5.13.3 AUSTRALIA
           5.13.4 BRAZIL
           5.13.5 SOUTH KOREA
           5.13.6 SPAIN
           5.13.7 MEXICO
           5.13.8 THAILAND
           5.13.9 POLAND
                    5.13.10 TURKEY
    5.14 TRENDS/DISRUPTIONS IMPACTING CUSTOMER’S BUSINESS 
           FIGURE 25 TRENDS/DISRUPTIONS IMPACTING CUSTOMER’S BUSINESS IN PLGA MARKET
    5.15 KEY CONFERENCES & EVENTS IN 2024–2025 
           TABLE 7 PLGA MARKET: KEY CONFERENCES & EVENTS, 2024–2025
    5.16 KEY STAKEHOLDERS & BUYING CRITERIA 
           5.16.1 KEY UNMET NEEDS OF VARIOUS END USERS
    5.17 KEY STAKEHOLDERS IN BUYING PROCESS 
           5.17.1 BUYING CRITERIA
                     FIGURE 26 SUPPLIER SELECTION CRITERION
                    5.17.1.1 Price
                    5.17.1.2 Sustainability
                    5.17.1.3 Performance (Barrier Properties)
                    5.17.1.4 Availability
                    5.17.1.5 Regulations
                    5.17.1.6 Brand Reputation
                    5.17.1.7 Market Trends
                    5.17.1.8 Application Suitability
    5.18 COMPARATIVE MARKET REPLACEMENT ASSESSMENT FOR PLGA REPLACING ALTERNATIVE POLYMERS 
           5.18.1 FOOD PACKAGING
                    5.18.1.1 Comparison with bio-based polymers
                    5.18.1.2 Comparison with fossil-based polymers
           5.18.2 DISPOSABLE CUTLERY
                    5.18.2.1 Comparison with bio-based polymers
                    5.18.2.2 Comparison with fossil-based polymers
           5.18.3 AGRICULTURE FILMS
                    5.18.3.1 Comparison with bio-based polymers
                    5.18.3.2 Comparison with fossil-based polymers
    5.19 PRICING ANALYSIS 
           5.19.1 PLGA PRICING TREND
                    5.19.1.1 Average selling price trend, by end user
                                 FIGURE 27 AVERAGE SELLING PRICE, BY PRODUCT TYPE (USD/KG)
           5.19.2 PLGA PRICES IN COMPARISON OF OTHER NEAREST COMPETING POLYMERS
                    5.19.2.1 Comparative average selling price trend, by type
                                 FIGURE 28 COMPARATIVE AVERAGE SELLING PRICE, BY PRODUCT TYPE (USD/KG)
    5.2 CASE STUDY ANALYSIS 
           5.20.1 NOMISMA HEALTHCARE
    5.21 INVESTMENT AND FUNDING SCENARIO 
           FIGURE 29 INVESTMENT AND FUNDING SCENARIO
    5.22 FUNDING, BY USE-CASE/APPLICATION 
           FIGURE 30 FUNDING, BY USE-CASE/APPLICATION
 
6 PLGA MARKET, BY END-USE INDUSTRY (Page No. - 81)
    6.1 INTRODUCTION 
          FIGURE 31 PLGA MARKET, BY END-USE INDUSTRY, 2023–2030 (USD MILLION)
          TABLE 8 PLGA MARKET, BY END-USE INDUSTRY, 2020–2022 (USD MILLION)
          TABLE 9 PLGA MARKET, BY END-USE INDUSTRY, 2023–2030 (USD MILLION)
          TABLE 10 PLGA MARKET, BY END-USE INDUSTRY, 2020–2022 (TON)
          TABLE 11 PLGA MARKET, BY END-USE INDUSTRY, 2023–2030 (TON)
    6.2 HEALTHCARE 
           6.2.1 INNOVATION IN TREATMENT OPTIONS TO DRIVE MARKET
    6.3 BIOTECH FIRMS 
           6.3.1 INCREASING DEMAND FOR REGENERATIVE THERAPIES TO DRIVE MARKET
    6.4 MEDICAL INSTITUTIONS 
           6.4.1 WIDESPREAD ADOPTION AND INTEGRATION TO DRIVE MARKET
    6.5 PACKAGING 
           6.5.1 COMPATIBILITY WITH INDUSTRY REGULATIONS TO DRIVE MARKET
    6.6 TEXTILE 
           6.6.1 GROWING DEMAND FOR SUSTAINABLE AND ETHICALLY PRODUCED GOODS TO DRIVE MARKET
    6.7 AGRICULTURE 
           6.7.1 LOW LABOR AND OPERATIONAL COSTS TO DRIVE MARKET
    6.8 OTHER END-USE INDUSTRIES 
 
7 PLGA MARKET, BY COMPOSITION (Page No. - 87)
    7.1 INTRODUCTION 
          FIGURE 32 PLGA MARKET, BY COMPOSITION, 2023–2030 (USD MILLION)
          TABLE 12 PLGA MARKET, BY COMPOSITION, 2020–2022 (USD MILLION)
          TABLE 13 PLGA MARKET, BY COMPOSITION, 2023–2030 (USD MILLION)
    7.2 HIGH LACTIC ACID GRADE 
           7.2.1 DEVELOPMENT OF ADVANCED MEDICAL TREATMENTS AND INTERVENTIONS TO DRIVE MARKET
           7.2.2 PLGA 50:50
           7.2.3 PLGA 55:45
           7.2.4 PLGA 65:35
           7.2.5 PLGA 75:25
           7.2.6 PLGA 85:15
           7.2.7 OTHER HIGH LACTIC ACID GRADE
    7.3 HIGH GLYCOLIC ACID GRADE 
           7.3.1 ADVANCED DEGRADATION KINETICS AND HYDROPHILICITY TO DRIVE MARKET
           7.3.2 PLGA 12:88
           7.3.3 PLGA 10:90
           7.3.4 OTHER HIGH GLYCOLIC ACID GRADE
 
8 PLGA MARKET, BY APPLICATION (Page No. - 93)
    8.1 INTRODUCTION 
          FIGURE 33 NON-MEDICAL APPLICATION TO REGISTER HIGHER CAGR DURING FORECAST PERIOD
          TABLE 14 PLGA MARKET, BY APPLICATION, 2020–2022 (USD MILLION)
          TABLE 15 PLGA MARKET, BY APPLICATION, 2023–2030 (USD MILLION)
    8.2 MEDICAL APPLICATIONS 
    8.3 NON-MEDICAL APPLICATIONS 
           8.3.1 PACKAGING
                    8.3.1.1 Food Packaging
                    8.3.1.2 Other packaging applications
           8.3.2 DISPOSABLE CUTLERY
           8.3.3 TEXTILE
           8.3.4 AGRICULTURE FILMS
           8.3.5 OTHER NON-MEDICAL APPLICATIONS
 
9 PLGA MARKET, BY PROCESSIBILITY (Page No. - 100)
    9.1 INTRODUCTION 
          FIGURE 34 INJECTION MOLDING SEGMENT TO REGISTER HIGHEST CAGR DURING FORECAST PERIOD
          TABLE 16 PLGA MARKET, BY PROCESSIBILITY, 2020–2022 (USD MILLION)
          TABLE 17 PLGA MARKET, BY PROCESSIBILITY, 2023–2030 (USD MILLION)
    9.2 EXTRUSION 
    9.3 INJECTION MOLDING 
    9.4 OTHER PROCESSIBILITIES 
 
10 PLGA MARKET, BY REGION (Page No. - 103)
     10.1 INTRODUCTION 
             FIGURE 35 JAPAN TO LEAD PLGA MARKET DURING FORECAST PERIOD
             TABLE 18 PLGA MARKET, BY REGION, 2020–2022 (USD MILLION)
             TABLE 19 PLGA MARKET, BY REGION, 2023–2030 (USD MILLION)
             TABLE 20 PLGA MARKET, BY REGION, 2020–2022 (TON)
             TABLE 21 PLGA MARKET, BY REGION, 2023–2030 (TON)
     10.2 NORTH AMERICA 
             10.2.1 RECESSION IMPACT
                        FIGURE 36 NORTH AMERICA: PLGA MARKET SNAPSHOT
                        TABLE 22 NORTH AMERICA: PLGA MARKET, BY COUNTRY, 2020–2022 (USD MILLION)
                        TABLE 23 NORTH AMERICA: PLGA MARKET, BY COUNTRY, 2023–2030 (USD MILLION)
                        TABLE 24 NORTH AMERICA: PLGA MARKET, BY COUNTRY, 2020–2022 (TON)
                        TABLE 25 NORTH AMERICA: PLGA MARKET, BY COUNTRY, 2023–2030 (TON)
                        TABLE 26 NORTH AMERICA: PLGA MARKET, BY END-USE INDUSTRY, 2020–2022 (USD MILLION)
                        TABLE 27 NORTH AMERICA: PLGA MARKET, BY END-USE INDUSTRY, 2023–2030 (USD MILLION)
                        TABLE 28 NORTH AMERICA: PLGA MARKET, BY END-USE INDUSTRY, 2020–2022 (TON)
                        TABLE 29 NORTH AMERICA: PLGA MARKET, BY END-USE INDUSTRY, 2023–2030 (TON)
             10.2.2 US
                        10.2.2.1 Stringent environmental regulations to drive market
                                      TABLE 30 US: PLGA MARKET, BY END-USE INDUSTRY, 2020–2022 (USD MILLION)
                                      TABLE 31 US: PLGA MARKET, BY END-USE INDUSTRY, 2023–2030 (USD MILLION)
             10.2.3 CANADA
                        10.2.3.1 Highly diversified and developed economy to drive market
                                      TABLE 32 CANADA: PLGA MARKET, BY END-USE INDUSTRY, 2020–2022 (USD MILLION)
                                      TABLE 33 CANADA: PLGA MARKET, BY END-USE INDUSTRY, 2023–2030 (USD MILLION)
             10.2.4 MEXICO
                        10.2.4.1 Skilled workforce, geographic advantages, and political and economic stability to drive market
                                      TABLE 34 MEXICO: PLGA MARKET, BY END-USE INDUSTRY, 2020–2022 (USD MILLION)
                                      TABLE 35 MEXICO: PLGA MARKET, BY END-USE INDUSTRY, 2023–2030 (USD MILLION)
     10.3 ASIA PACIFIC 
             10.3.1 RECESSION IMPACT
                        FIGURE 37 ASIA PACIFIC: PLGA MARKET SNAPSHOT
                        TABLE 36 ASIA PACIFIC: PLGA MARKET, BY COUNTRY, 2020–2022 (USD MILLION)
                        TABLE 37 ASIA PACIFIC: PLGA MARKET, BY COUNTRY, 2023–2030 (USD MILLION)
                        TABLE 38 ASIA PACIFIC: PLGA MARKET, BY COUNTRY, 2020–2022 (TON)
                        TABLE 39 ASIA PACIFIC: PLGA MARKET, BY COUNTRY, 2023–2030 (TON)
                        TABLE 40 ASIA PACIFIC: PLGA MARKET, BY END-USE INDUSTRY, 2020–2022 (USD MILLION)
                        TABLE 41 ASIA PACIFIC: PLGA MARKET, BY END-USE INDUSTRY, 2023–2030 (USD MILLION)
                        TABLE 42 ASIA PACIFIC: PLGA MARKET, BY END-USE INDUSTRY, 2020–2022 (TON)
                        TABLE 43 ASIA PACIFIC: PLGA MARKET, BY END-USE INDUSTRY, 2023–2030 (TON)
             10.3.2 CHINA
                        10.3.2.1 Stringent regulatory frameworks and open economy to drive market
                                      TABLE 44 CHINA: PLGA MARKET, BY END-USE INDUSTRY, 2020–2022 (USD MILLION)
                                      TABLE 45 CHINA: PLGA MARKET, BY END-USE INDUSTRY, 2023–2030 (USD MILLION)
             10.3.3 JAPAN
                        10.3.3.1 Rapidly aging population and well-established R&D centers to drive market
                                      TABLE 46 JAPAN: PLGA MARKET, BY END-USE INDUSTRY, 2020–2022 (USD MILLION)
                                      TABLE 47 JAPAN: PLGA MARKET, BY END-USE INDUSTRY, 2023–2030 (USD MILLION)
             10.3.4 INDIA
                        10.3.4.1 High purchasing power, changing buyers’ preferences, and government initiatives to drive market
                                      TABLE 48 INDIA: PLGA MARKET, BY END-USE INDUSTRY, 2020–2022 (USD MILLION)
                                      TABLE 49 INDIA: PLGA MARKET, BY END-USE INDUSTRY, 2023–2030 (USD MILLION)
             10.3.5 SOUTH KOREA
                        10.3.5.1 Favorable government policies to drive market
                                      TABLE 50 SOUTH KOREA: PLGA MARKET, BY END-USE INDUSTRY, 2020–2022 (USD MILLION)
                                      TABLE 51 SOUTH KOREA: PLGA MARKET, BY END-USE INDUSTRY, 2023–2030 (USD MILLION)
             10.3.6 REST OF ASIA PACIFIC
                        TABLE 52 REST OF ASIA PACIFIC: PLGA MARKET, BY END-USE INDUSTRY, 2020–2022 (USD MILLION)
                        TABLE 53 REST OF ASIA PACIFIC: PLGA MARKET, BY END-USE INDUSTRY, 2023–2030 (USD MILLION)
     10.4 EUROPE 
             10.4.1 RECESSION IMPACT
                        FIGURE 38 EUROPE: PLGA MARKET SNAPSHOT
                        TABLE 54 EUROPE: PLGA MARKET, BY COUNTRY, 2020–2022 (USD MILLION)
                        TABLE 55 EUROPE: PLGA MARKET, BY COUNTRY, 2023–2030 (USD MILLION)
                        TABLE 56 EUROPE: PLGA MARKET, BY COUNTRY, 2020–2022 (TON)
                        TABLE 57 EUROPE: PLGA MARKET, BY COUNTRY, 2023–2030 (TON)
                        TABLE 58 EUROPE: PLGA MARKET, BY END-USE INDUSTRY, 2020–2022 (USD MILLION)
                        TABLE 59 EUROPE: PLGA MARKET, BY END-USE INDUSTRY, 2023–2030 (USD MILLION)
                        TABLE 60 EUROPE: PLGA MARKET, BY END-USE INDUSTRY, 2020–2022 (TON)
                        TABLE 61 EUROPE: PLGA MARKET, BY END-USE INDUSTRY, 2023–2030 (TON)
             10.4.2 GERMANY
                        10.4.2.1 Business-friendly tax conditions and export-driven economy to drive market
                                      TABLE 62 GERMANY: PLGA MARKET, BY END-USE INDUSTRY, 2020–2022 (USD MILLION)
                                      TABLE 63 GERMANY: PLGA MARKET, BY END-USE INDUSTRY, 2023–2030 (USD MILLION)
             10.4.3 FRANCE
                        10.4.3.1 Final incentives and single-use plastic ban to boost market
                                      TABLE 64 FRANCE: PLGA MARKET, BY END-USE INDUSTRY, 2020–2022 (USD MILLION)
                                      TABLE 65 FRANCE: PLGA MARKET, BY END-USE INDUSTRY, 2023–2030 (USD MILLION)
             10.4.4 UK
                        10.4.4.1 New reformed policies and renewed investments to drive market
                                      TABLE 66 UK: PLGA MARKET, BY END-USE INDUSTRY, 2020–2022 (USD MILLION)
                                      TABLE 67 UK: PLGA MARKET, BY END-USE INDUSTRY, 2023–2030 (USD MILLION)
             10.4.5 ITALY
                        10.4.5.1 Growth of packaging industry to boost market
                                      TABLE 68 ITALY: PLGA MARKET, BY END-USE INDUSTRY, 2020–2022 (USD MILLION)
                                      TABLE 69 ITALY: PLGA MARKET, BY END-USE INDUSTRY, 2023–2030 (USD MILLION)
             10.4.6 REST OF EUROPE
                        TABLE 70 REST OF EUROPE: PLGA MARKET, BY END-USE INDUSTRY, 2020–2022 (USD MILLION)
                        TABLE 71 REST OF EUROPE: PLGA MARKET, BY END-USE INDUSTRY, 2023–2030 (USD MILLION)
     10.5 MIDDLE EAST & AFRICA 
             10.5.1 RECESSION IMPACT
                        TABLE 72 MIDDLE EAST & AFRICA: PLGA MARKET, BY COUNTRY, 2020–2022 (USD MILLION)
                        TABLE 73 MIDDLE EAST & AFRICA: PLGA MARKET, BY COUNTRY, 2023–2030 (USD MILLION)
                        TABLE 74 MIDDLE EAST & AFRICA: PLGA MARKET, BY COUNTRY, 2020–2022 (TON)
                        TABLE 75 MIDDLE EAST & AFRICA: PLGA MARKET, BY COUNTRY, 2023–2030 (TON)
                        TABLE 76 MIDDLE EAST & AFRICA: PLGA MARKET, BY END-USE INDUSTRY, 2020–2022 (USD MILLION)
                        TABLE 77 MIDDLE EAST & AFRICA: PLGA MARKET, BY END-USE INDUSTRY, 2023–2030 (USD MILLION)
                        TABLE 78 MIDDLE EAST & AFRICA: PLGA MARKET, BY END-USE INDUSTRY, 2020–2022 (TON)
                        TABLE 79 MIDDLE EAST & AFRICA: PLGA MARKET, BY END-USE INDUSTRY, 2023–2030 (TON)
             10.5.2 GCC COUNTRIES
                        TABLE 80 GCC COUNTRIES: PLGA MARKET, BY END-USE INDUSTRY, 2020–2022 (USD MILLION)
                        TABLE 81 GCC COUNTRIES: PLGA MARKET, BY END-USE INDUSTRY, 2023–2030 (USD MILLION)
                        10.5.2.1 SAUDI ARABIA
                                     10.5.2.1.1 Demographic shifts, urbanization, and workforce productivity to drive market
                                                     TABLE 82 SAUDI ARABIA: PLGA MARKET, BY END-USE INDUSTRY, 2020–2022 (USD MILLION)
                                                     TABLE 83 SAUDI ARABIA: PLGA MARKET, BY END-USE INDUSTRY, 2023–2030 (USD MILLION)
             10.5.3 SOUTH AFRICA
                        10.5.3.1 Advancements in bioplastic research and innovation to drive market
                                      TABLE 84 SOUTH AFRICA: PLGA MARKET, BY END-USE INDUSTRY, 2020–2022 (USD MILLION)
                                      TABLE 85 SOUTH AFRICA: PLGA MARKET, BY END-USE INDUSTRY, 2023–2030 (USD MILLION)
             10.5.4 REST OF THE MIDDLE EAST & AFRICA
                        TABLE 86 REST OF MIDDLE EAST & AFRICA: PLGA MARKET, BY END-USE INDUSTRY, 2020–2022 (USD MILLION)
                        TABLE 87 REST OF MIDDLE EAST & AFRICA: PLGA MARKET, BY END-USE INDUSTRY, 2023–2030 (USD MILLION)
     10.6 SOUTH AMERICA 
             10.6.1 RECESSION IMPACT
                        TABLE 88 SOUTH AMERICA: PLGA MARKET, BY COUNTRY, 2020–2022 (USD MILLION)
                        TABLE 89 SOUTH AMERICA: PLGA MARKET, BY COUNTRY, 2023–2030 (USD MILLION)
                        TABLE 90 SOUTH AMERICA: PLGA MARKET, BY COUNTRY, 2020–2022 (TON)
                        TABLE 91 SOUTH AMERICA: PLGA MARKET, BY COUNTRY, 2023–2030 (TON)
                        TABLE 92 SOUTH AMERICA: PLGA MARKET, BY END-USE INDUSTRY, 2020–2022 (USD MILLION)
                        TABLE 93 SOUTH AMERICA: PLGA MARKET, BY END-USE INDUSTRY, 2023–2030 (USD MILLION)
                        TABLE 94 SOUTH AMERICA: PLGA MARKET, BY END-USE INDUSTRY, 2020–2022 (TON)
                        TABLE 95 SOUTH AMERICA: PLGA MARKET, BY END-USE INDUSTRY, 2023–2030 (TON)
             10.6.2 BRAZIL
                        10.6.2.1 High demand for personal care, home care & toiletries, and functional & nutraceutical foods to drive market
                                      TABLE 96 BRAZIL: PLGA MARKET, BY END-USE INDUSTRY, 2020–2022 (USD MILLION)
                                      TABLE 97 BRAZIL: PLGA MARKET, BY END-USE INDUSTRY, 2023–2030 (USD MILLION)
             10.6.3 REST OF SOUTH AMERICA
                        TABLE 98 REST OF SOUTH AMERICA: PLGA MARKET, BY END-USE INDUSTRY, 2020–2022 (USD MILLION)
                        TABLE 99 REST OF SOUTH AMERICA: PLGA MARKET, BY END-USE INDUSTRY, 2023–2030 (USD MILLION)
 
11 COMPETITIVE LANDSCAPE (Page No. - 142)
     11.1 KEY PLAYER STRATEGIES/RIGHT TO WIN 
             FIGURE 39 COMPANIES ADOPTED PRODUCT LAUNCH AND EXPANSION AS KEY GROWTH STRATEGIES BETWEEN 2019 AND 2023
     11.2 REVENUE ANALYSIS 
             FIGURE 40 REVENUE ANALYSIS
     11.3 MARKET SHARE ANALYSIS 
             FIGURE 41 RANKING OF KEY MARKET PLAYERS
             FIGURE 42 MARKET SHARE OF KEY PLAYERS, 2023
             TABLE 100 PLGA MARKET: DEGREE OF COMPETITION
     11.4 COMPANY EVALUATION MATRIX, 2023 (TIER 1) 
             11.4.1 STAR PLAYERS
             11.4.2 EMERGING LEADERS
             11.4.3 PERVASIVE PLAYERS
             11.4.4 PARTICIPANTS
                        FIGURE 43 PLGA MARKET: COMPANY EVALUATION MATRIX, 2023
             11.4.5 COMPANY FOOTPRINT
                        TABLE 101 COMPANY END-USE INDUSTRY FOOTPRINT
                        TABLE 102 COMPANY REGION FOOTPRINT
                        FIGURE 44 COMPANY PRODUCT FOOTPRINT
                        TABLE 103 COMPANY FOOTPRINT
     11.5 START-UPS/SMES EVALUATION MATRIX 
             11.5.1 PROGRESSIVE COMPANIES
             11.5.2 RESPONSIVE COMPANIES
             11.5.3 DYNAMIC COMPANIES
             11.5.4 STARTING BLOCKS
                        FIGURE 45 PLGA MARKET: START-UPS AND SMES MATRIX, 2023
             11.5.5 COMPETITIVE BENCHMARKING
                        TABLE 104 PLGA MARKET: COMPETITIVE BENCHMARKING OF KEY START-UPS/SMES
                        TABLE 105 DETAILED LIST OF COMPANIES
     11.6 COMPANY VALUATION AND FINANCIAL MATRIX 
             FIGURE 46 COMPANY VALUATION
             FIGURE 47 FINANCIAL METRICS
     11.7 BRAND/PRODUCT COMPARISON 
             FIGURE 48 BRAND/PRODUCT COMPARISON
     11.8 COMPETITIVE SCENARIO AND TRENDS 
             11.8.1 PRODUCT LAUNCHES
                        TABLE 106 PLGA MARKET: PRODUCT LAUNCHES, JANUARY 2019–DECEMBER 2023
             11.8.2 DEALS
                        TABLE 107 PLGA MARKET: DEALS, JANUARY 2019–DECEMBER 2023
             11.8.3 EXPANSIONS
                        TABLE 108 PLGA MARKET: EXPANSIONS, JANUARY 2019–DECEMBER 2023
 
12 COMPANY PROFILES (Page No. - 160)
     12.1 MAJOR PLAYERS 
(Business Overview, Products/Solutions/Services offered, Recent Developments, MnM View)*
             12.1.1 EVONIK
                        TABLE 109 EVONIK: COMPANY OVERVIEW
                        FIGURE 49 EVONIK: COMPANY SNAPSHOT
                        TABLE 110 EVONIK: PRODUCTS/SOLUTIONS/SERVICES OFFERED
                        TABLE 111 EVONIK: PRODUCT LAUNCHES
                        TABLE 112 EVONIK: DEALS
                        TABLE 113 EVONIK: OTHERS
             12.1.2 CORBION NV
                        TABLE 114 CORBION NV: COMPANY OVERVIEW
                        FIGURE 50 CORBION NV: COMPANY SNAPSHOT
                        TABLE 115 CORBION NV: PRODUCTS/SOLUTIONS/SERVICES OFFERED
                        TABLE 116 CORBION NV: DEALS
                        TABLE 117 CORBION NV: OTHERS
             12.1.3 ASHLAND
                        TABLE 118 ASHLAND: COMPANY OVERVIEW
                        FIGURE 51 ASHLAND: COMPANY SNAPSHOT
                        TABLE 119 ASHLAND: PRODUCTS/SOLUTIONS/SERVICES OFFERED
                        TABLE 120 ASHLAND: PRODUCT LAUNCHES
                        TABLE 121 ASHLAND: OTHERS
             12.1.4 MITSUI CHEMICALS
                        TABLE 122 MITSUI CHEMICALS: COMPANY OVERVIEW
                        FIGURE 52 MITSUI CHEMICALS: COMPANY SNAPSHOT
                        TABLE 123 MITSUI CHEMICALS: PRODUCTS/SOLUTIONS/SERVICES OFFERED
             12.1.5 MERCK KGAA
                        TABLE 124 MERCK KGAA: COMPANY OVERVIEW
                        TABLE 125 MERCK KGAA: PRODUCTS/SOLUTIONS/SERVICES OFFERED
                        TABLE 126 MERCK KGAA: DEALS
                        TABLE 127 MERCK KGAA: OTHERS
             12.1.6 JINAN DAIGANG BIOENGINEERING CO., LTD.
                        TABLE 128 JINAN DAIGANG BIOENGINEERING CO., LTD.: COMPANY OVERVIEW
                        TABLE 129 JINAN DAIGANG BIOENGINEERING CO., LTD.: PRODUCTS/SOLUTIONS/ SERVICES OFFERED
             12.1.7 AKINA, INC.
                        TABLE 130 AKINA, INC.: COMPANY OVERVIEW
                        TABLE 131 AKINA, INC.: PRODUCTS/SOLUTIONS/SERVICES OFFERED
             12.1.8 NOMISMA HEALTHCARE PVT. LTD.
                        TABLE 132 NOMISMA HEALTHCARE PVT. LTD.: COMPANY OVERVIEW
                        TABLE 133 NOMISMA HEALTHCARE PVT. LTD.: PRODUCTS/SOLUTIONS/SERVICES OFFERED
             12.1.9 BEZWADA BIOMEDICAL, LLC
                        TABLE 134 BEZWADA BIOMEDICAL, LLC: COMPANY OVERVIEW
                        TABLE 135 BEZWADA BIOMEDICAL, LLC: PRODUCTS/SOLUTIONS/SERVICES OFFERED
             12.1.10 CD BIOPARTICLES
                        TABLE 136 CD BIOPARTICLES: COMPANY OVERVIEW
                        TABLE 137 CD BIOPARTICLES: PRODUCTS/SOLUTIONS/SERVICES OFFERED
     12.2 OTHER KEY PLAYERS 
             12.2.1 CREATIVE PEGWORKS
                        TABLE 138 CREATIVE PEGWORKS: COMPANY OVERVIEW
             12.2.2 POLYSCIENCES, INC.
                        TABLE 139 POLYSCIENCES, INC.: COMPANY OVERVIEW
             12.2.3 SEQENS
                        TABLE 140 SEQENS: COMPANY OVERVIEW
             12.2.4 ZEUS COMPANY INC.
                        TABLE 141 ZEUS COMPANY INC.: COMPANY OVERVIEW
             12.2.5 HOSOKAWA MICRON GROUP
                        TABLE 142 HOSOKAWA MICRON GROUP: COMPANY OVERVIEW
             12.2.6 BIOSYNTH LTD.
                        TABLE 143 BIOSYNTH LTD.: COMPANY OVERVIEW
             12.2.7 FOSTER CORPORATION
                        TABLE 144 FOSTER CORPORATION: COMPANY OVERVIEW
             12.2.8 TELEFLEX MEDICAL OEM
                        TABLE 145 TELEFLEX MEDICAL OEM.: COMPANY OVERVIEW
             12.2.9 ALFA CHEMISTRY
                        TABLE 146 ALFA CHEMISTRY: COMPANY OVERVIEW
             12.2.10 CREATIVE DIAGNOSTICS
                        TABLE 147 CREATIVE DIAGNOSTICS: COMPANY OVERVIEW
             12.2.11 TTY BIOPHARM
                        TABLE 148 TTY BIOPHARM: COMPANY OVERVIEW
             12.2.12 BMG INC.
                        TABLE 149 BMG INC.: COMPANY OVERVIEW
             12.2.13 MUSASHINO
                        TABLE 150 MUSASHINO: COMPANY OVERVIEW
             12.2.14 SPECIFIC POLYMERS
                        TABLE 151 SPECIFIC POLYMERS: COMPANY OVERVIEW
             12.2.15 FORTIS LIFE SCIENCES
                        TABLE 152 FORTIS LIFE SCIENCES: COMPANY OVERVIEW
 
*Details on Business Overview, Products/Solutions/Services offered, Recent Developments, MnM View might not be captured in case of unlisted companies.
 
13 APPENDIX (Page No. - 194)
     13.1 DISCUSSION GUIDE 
     13.2 KNOWLEDGESTORE: MARKETSANDMARKETS’ SUBSCRIPTION PORTAL 
     13.3 CUSTOMIZATION OPTIONS 
     13.4 RELATED REPORTS 
     13.5 AUTHOR DETAILS 

The study involved four major activities in estimating the market size of the PLGA market. Exhaustive secondary research was done to collect information on the market, the peer market, and the grandparent market. The next step was to validate these findings, assumptions, and sizing with industry experts across the value chain through primary research. Both top-down and bottom-up approaches were employed to estimate the complete market size. Thereafter, the market breakdown and data triangulation procedures were used to estimate the market size of the segments and subsegments.

Secondary Research

In the secondary research process, various secondary sources have been referred to for identifying and collecting information for this study. These secondary sources include annual reports, press releases, investor presentations of companies, white papers, certified publications, trade directories, articles from recognized authors, gold standard and silver standard websites, and databases. Secondary research has been used to obtain key information about the value chain of the industry, monetary chain of the market, the total pool of key players, market classification and segmentation according to industry trends to the bottom-most level, and regional markets. It was also used to obtain information about the key developments from a market-oriented perspective.

Primary Research

The PLGA market comprises several stakeholders in the value chain, which include manufacturers, and end users. Various primary sources from the supply and demand sides of the PLGA market have been interviewed to obtain qualitative and quantitative information. The primary interviewees from the demand side include key opinion leaders in healthcare sector. The primary sources from the supply side include manufacturers, associations, and institutions involved in the PLGA industry. Primary interviews were conducted to gather insights such as market statistics, data of revenue collected from the products and services, market breakdowns, market size estimations, market forecasting, and data triangulation. Primary research also helped in understanding the various trends related to composition, processibility, application, end-use industry, and region. Stakeholders from the demand side, such as CIOs, CTOs, and CSOs were interviewed to understand the buyer’s perspective on the suppliers, products, component providers, and their current usage of PLGA and outlook of their business, which will affect the overall market.

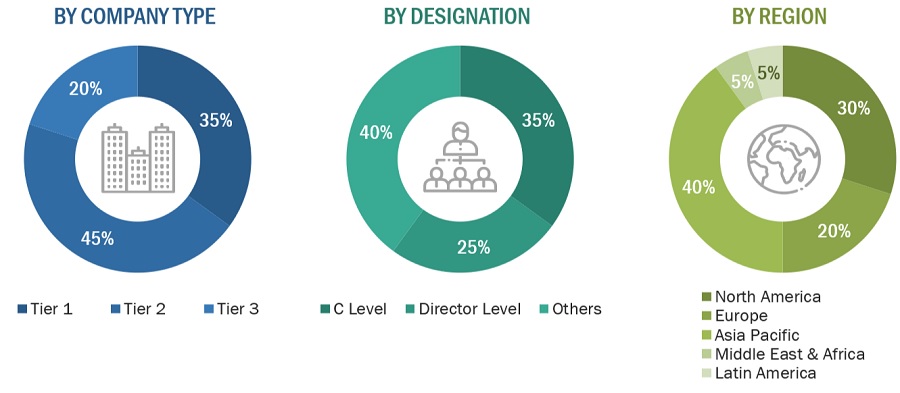
The breakdown of profiles of the primary interviewees is illustrated in the figure below:
PLGA Market Size, and Share

Note: Tier 1, Tier 2, and Tier 3 companies are classified based on their market revenue in 2023 available in the public domain, product portfolios, and geographical presence.

Other designations include consultants and sales, marketing, and procurement managers.

To know about the assumptions considered for the study, download the pdf brochure

Market Size Estimation

The top-down and bottom-up approaches have been used to estimate and validate the size of the PLGA market.

  • The key players in the industry have been identified through extensive secondary research.
  • The supply chain of the industry has been determined through primary and secondary research.
  • All percentage shares, splits, and breakdowns have been determined using secondary sources and verified through primary sources.
  • All possible parameters that affect the markets covered in this research study have been accounted for, viewed in extensive detail, verified through primary research, and analyzed to obtain the final quantitative and qualitative data.
  • The research includes the study of reports, reviews, and newsletters of the key market players, along with extensive interviews for opinions with leaders such as directors and marketing executives.

Top - Down Approach-

PLGA Market Size, and Share

To know about the assumptions considered for the study, Request for Free Sample Report

Bottom - Up Approach-

PLGA Market Size, and Share

Data Triangulation

After arriving at the total market size from the estimation process, the overall market has been split into several segments and sub-segments. To complete the overall market engineering process and arrive at the exact statistics for all the segments and sub-segments, the data triangulation and market breakdown procedures have been employed, wherever applicable. The data has been triangulated by studying various factors and trends from both the demand and supply sides. Along with this, the market size has been validated by using both the top-down and bottom-up approaches and primary interviews. Hence, for every data segment, there have been three sources—top-down approach, bottom-up approach, and expert interviews. The data was assumed correct when the values arrived from the three sources matched.

Market Definition

PLGA, a group of biodegradable polymers approved by the FDA, stands out for its robustness, excellent biocompatibility, and extensive research as carriers for drugs, proteins, and diverse macromolecules like DNA, RNA, and peptides. Its popularity in the realm of biodegradable polymers stems from its extensive clinical track record, advantageous degradation properties, and potential for prolonged drug release.

Key Stakeholders

  • Senior Management
  • End User
  • Finance/Procurement Department
  • R&D Department
  • Manufacturers
  • Raw Material Suppliers

Report Objectives

  • To define, describe, and forecast the size of the PLGA market, in terms of value and volume.
  • To provide detailed information regarding the major factors (drivers, opportunities, restraints, and challenges) influencing the growth of the market
  • To estimate and forecast the market size based on composition, processibility, end-use industry, application, and region.
  • To forecast the size of the market with respect to major regions, namely, Europe, North America, Asia Pacific, Middle East & Africa, and South America, along with their key countries
  • To strategically analyze micromarkets with respect to individual growth trends, prospects, and their contribution to the overall market
  • To analyze opportunities in the market for stakeholders and provide a competitive landscape of market leaders.
  • To track and analyze recent developments such as expansions, new product launches, partnerships & agreements, and acquisitions in the market.
  • To strategically profile key market players and comprehensively analyze their core competencies.

Available Customizations

Along with the given market data, MarketsandMarkets offers customizations according to the company’s specific needs. The following customization options are available for the report:

Regional Analysis

  • Further breakdown of a region with respect to a particular country or additional application

Company Information

  • Detailed analysis and profiles of additional market players

Tariff & Regulations

  • Regulations and Impact on PLGA market
Custom Market Research Services

We will customize the research for you, in case the report listed above does not meet with your exact requirements. Our custom research will comprehensively cover the business information you require to help you arrive at strategic and profitable business decisions.

Request Customization
Report Code
CH 8978
Published ON
Mar, 2024
Choose License Type
BUY NOW
  • SHARE
X
Request Customization
Speak to Analyst
Speak to Analyst
OR FACE-TO-FACE MEETING
PERSONALIZE THIS RESEARCH
  • Triangulate with your Own Data
  • Get Data as per your Format and Definition
  • Gain a Deeper Dive on a Specific Application, Geography, Customer or Competitor
  • Any level of Personalization
REQUEST A FREE CUSTOMIZATION
LET US HELP YOU!
  • What are the Known and Unknown Adjacencies Impacting the PLGA Market
  • What will your New Revenue Sources be?
  • Who will be your Top Customer; what will make them switch?
  • Defend your Market Share or Win Competitors
  • Get a Scorecard for Target Partners
CUSTOMIZED WORKSHOP REQUEST
+1-888-600-6441
  • Call Us
  • +1-888-600-6441 (Corporate office hours)
  • +1-888-600-6441 (US/Can toll free)
  • +44-800-368-9399 (UK office hours)
CONNECT WITH US
ABOUT TRUST ONLINE
©2024 MarketsandMarkets Research Private Ltd. All rights reserved
DMCA.com Protection Status Website Feedback